We are pleased to announce that WLSDM 3.7.1 and WL-OPC 1.2.0 products are now common available for download on https://wlsdm.com/download page
Oracle Documentation: OPMN is no longer used in Oracle Fusion Middleware. Instead, system components are managed by the WebLogic Management Framework, which includes WLST, Node Manager and pack and unpack
WLSDM and WL-OPC offers a complete Oracle FMW product stack monitoring infrastructure for your FMW domains and their system components and instances (formerly OPMN processes).
Monitoring below Oracle FMW products’ WebLogic domains are not a big deal for WLSDM and WL-OPC users. You do not need to write any WLST scripts while “Monitoring the Status of Components Using the Command Line”.
- Oracle FMW OBIEE (Oracle Business Intelligence Enterprise Edition) — FMW BI Domains
- Oracle Traffic Director (OTD) Components and Instances
- Oracle HTTP Server (OHS) Components and Instances
- Oracle Forms and Reports (OFR) Components and Instances
- Oracle Data Integrator (ODI) Components and Instances
- Oracle E-Business Suite (EBS) Components and Instances
- Oracle Identity Management (IDM) Components and Instances
- Oracle Internet Directory (OID) Components and Instances
- Oracle Virtual Directory (OVD) Components and Instances
- Oracle Access Manager (OAM) Components and Instances
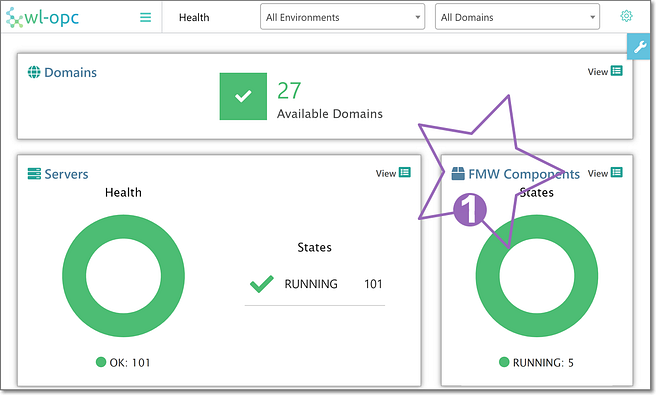
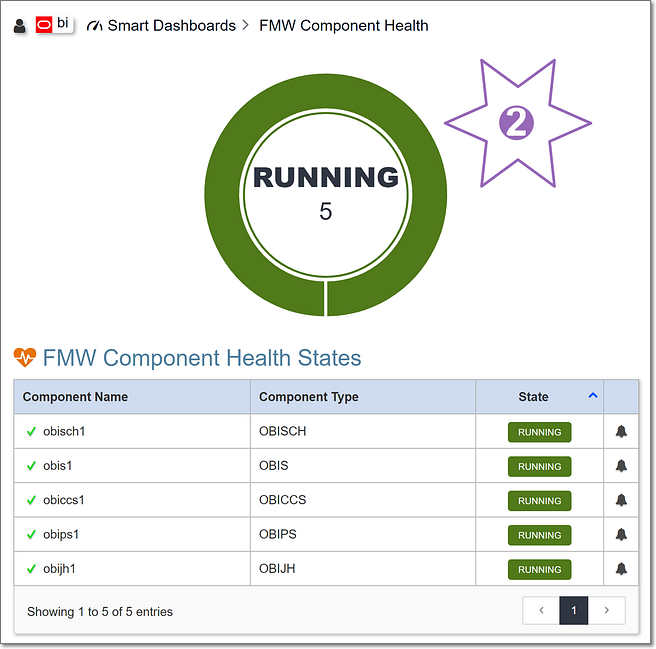
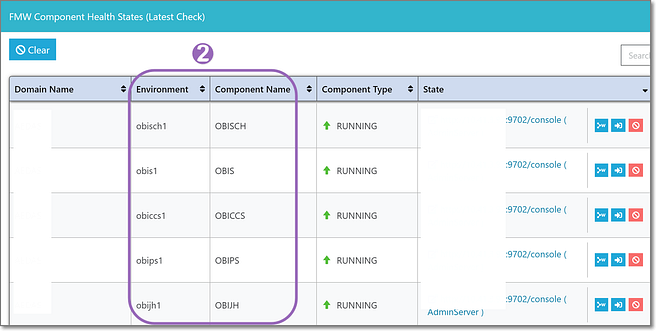
…etc. Monitoring and managing all FMW compatible system components are supported by WLSDM and central product WL-OPC. We have clients who have more than 100+ WebLogic and FMW domains and they monitor all their JVM instances and FMW products with WL-OPC really easily and proactively. Oracle Service Bus, Oracle SOA Suite, Oracle ERP, Oracle EBS, Oracle BI, ODI, OTD, OID, OVD, OAM… etc. various WebLogic domains but only one console. Check below screen captures for your reference as a new release visual spoiler.
1. WL-OPC FMW System Component Health Dashboard
2. WLSDM FMW System Component Health Dashboard
In this release we are offering another great feature to detect root causes for the performance bottlenecks and slowness for the deployed applications on your WebLogic domains. One of the biggest challenge is identifying and troubleshooting problems while working on WebLogic domains. WLSDM comes with a complete alert mechanism by pointing possible root cause events. For instance, you have received such as Hogger, Stuck, Open Socket, CPU, Pending User Requests or Thread pool QueueLength alarm notifications then you have additional below eyes anymore:
- Viewing Hogger threads’ stack traces
- Viewing Back-end events related with hogger thread IDs
- Viewing top CPU consumers JVMs or ManagedServers
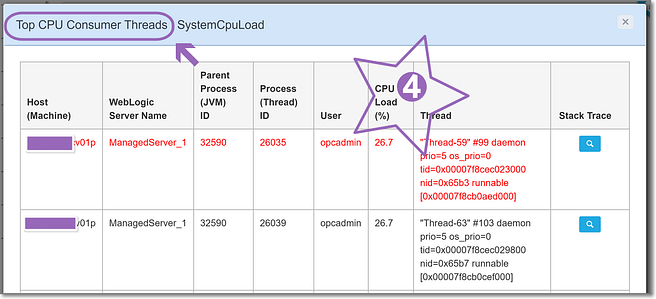
- Viewing top CPU consumer threads and their complete stack traces
- Viewing top JDBC SQL events with their SQL statements
- Viewing top EJB events with their EJB Business method invokes
- Viewing top Servlet events with their URI details and related operative set ECIDs
- Viewing top Web Service events
- Viewing top Socket and File I/O events and related operative set events
Check below screen captures for your reference:
3. Magical Possible Root Cause Icons Available Anymore

4. Top CPU Consumer Threads and Complete Thread Stack Trace
Neither Docker nor Kubernetes can help to solve your HOGGER and STUCK threads. But WLSDM and WL-OPC can help you 🙂
+Plus: WLSDM is totally compatible with cloud native infrastructure. Already a micro-service solution 😉
So please start targeting your WLSDM 3.4.2 installations to WLSDM 3.7.1 and integrate with WL-OPC 1.2.0. Take advantage of the latest release with the latest features and FMW system component functionalities.
I want to thank all of my teams and our clients that recommending lots of feature and enhancing our products continuously.
We hope having more updates for you soon!
M.Fevzi Korkutata
WLSDM/WL-OPC Product Manager
https://linkedin.com/in/mfevzikorkutata


